
|
|
|
|
Arabi Gin
Cotton 'Links'
Market Data
News
Weather
Market Alerts
Resources
|
What Three Different Financial Markets Were Telling Us at the End of May
Every Friday, Kitco News runs a poll, collecting votes from both Main Street and Wall Street on what direction gold is headed the next week. I used to look at the futures market from a technical point of view, using both the short-term daily and intermediate-term weekly charts, but eventually threw them out as largely irrelevant. Gold is a safe-haven market, and with global political uncertainty being ramped up seemingly every week, central banks from around the world have been buying and holding gold. We can consider this a key fundamental, with market price reflecting where the quantity demand equals quantities available creating a market equilibrium. This simple idea is the Law of Supply and Demand, something we learned back in Econ 101. Unfortunately, most of the folks who call themselves “economists” have forgotten this basis lesson. In fact, if you listen to them, something I gave up on years ago, you’ll notice most of what passes for “analysis” is nothing more than rhetoric based on which side of the political aisle on which the “economist” sits. We need to keep this in mind as the latest round of monthly economic “data” rolls in this week. I’ll talk all this in more detail in Friday’s piece. Today I want to focus on what three key markets from different sectors were telling us at the end of May: Gold (Metals), US 10-year T-Note futures (Financials), and the US dollar index (Currencies). Recall I talked about US stock indexes in Tuesday’s piece.  The monthly close-only chart for the Gold Cash Index (GCY00) is easy to read. Okay, I hear you. Yes, I’m talking technical analysis, applying the second basic tenet: Prices move in trends. What does this mean? The simplest definition of trend is price direction over time. Recall price is the market equilibrium of supply and demand, so price direction over time reflects changes in supply and demand over time. We can also apply Newton’s First Law of Motion to market analysis: A trending market will stay in that trend until acted upon by an outside force. In this case, that outside force would be a change in fundamentals, something not expected for the foreseeable future. As my weekly “Up” vote to Kitco indicates, gold’s long-term trend is up. It’s not rocket science. Do I know how high it might go? Absolutely not, and it’s foolish to guess. What I do know is the trend of the market seemed to change as December 2015 came to an end with the Index priced at $1,061.17. I think we all remember what happened during 2016. It’s also interesting to note the Index took a breather between July 2020 and November 2023 before going parabolic once again. The Index closed May 2025 priced at $3,290.23.  The monthly close-only chart for US 10-year T-note (ZNM25) futures (nearby contract) is in a sideways trend. Again, I’m aware of what some will call hypocrisy. What I’m looking at is the market’s opinion on interest rates, and what I see with 10-year futures is uncertainty. This makes sense given the political environment the US has created. Recall Moody’s downgraded the US sovereign debt credit rating during May, a move that immediately spike US Treasury yields on the idea the US Federal Open Market Committee (the FOMC, the Fed) had more ammunition to raise rates rather than make cuts over the coming months. However, as last month played out, Treasury markets calmed down leaving 10-year futures in a consolidation pattern, albeit a narrowing range as June got under way. In a couple weeks the Fed will hold its next meeting, concluding with an announcement on rates the afternoon of Wednesday, June 18. As of this morning (Wednesday, June 4) the Fed fund futures forward curve is showing the market is not expecting a change in rates until at least the September meeting (16 and 17). 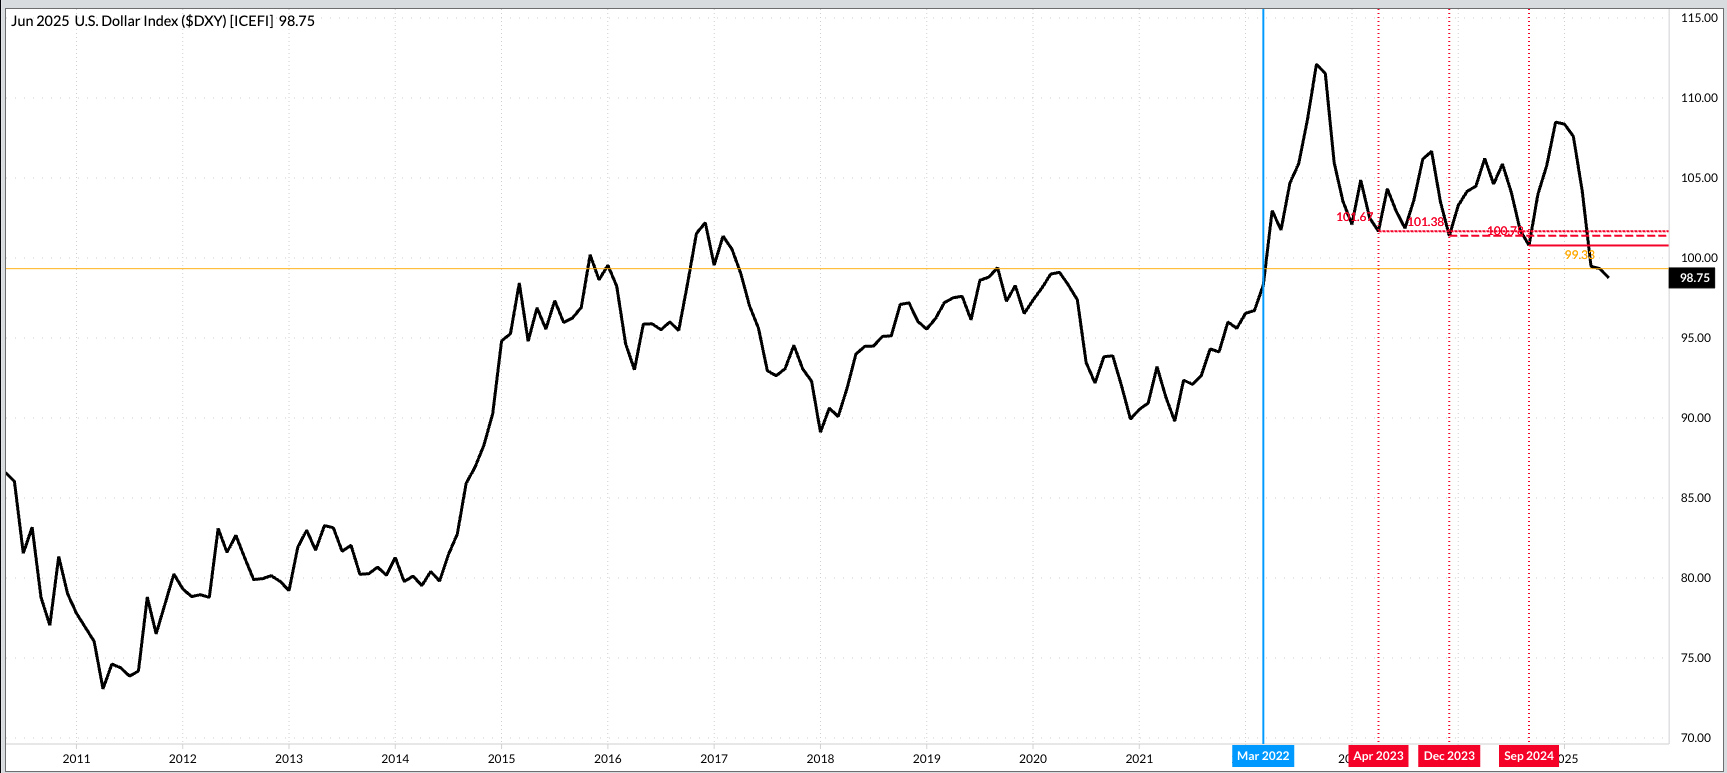 The US dollar index ($DXY) continues to post a series of lower monthly closes starting with April 2023 (101.67) and running through December 2023 (101.38) and September 2024 (100.78). By definition, a series of lower lows reflects a downtrend. Applying the Law of Supply and Demand it means there are more dollars available than demanded, in relation to a basket of global currencies. We could view this a number of ways: First, there are more dollars in circulation at a time when global demand is waning due to the US’ declining role as a major player on the global stage. This is an interesting take because for so many years the fear mongering was the political/economic alliance BRICS (Brazil, Russia, India, China, South Africa and others) was going to de-dollarize the world, but instead the US was willing to do it itself. Second, some will argue the greenback is weakening based on the idea the FOMC will lower rates. However, US Treasury markets do not support that piece of political rhetoric, at least not as of this writing. For now, the path of least resistance for the US dollar index is to continue weakening, for whatever reason. (Recall Market Rule #5 tells us it’s the what, not the why.) So here we are, the first week of meteorological summer with three key markets from different sectors showing us three different trends (up, sideways, and down). Taken as a whole they tell a consistent story: The chaos created by the US has shifted the search for stability to safe-haven markets and other global currencies. On the date of publication, Darin Newsom did not have (either directly or indirectly) positions in any of the securities mentioned in this article. All information and data in this article is solely for informational purposes. For more information please view the Barchart Disclosure Policy here. |
|
|